A Dashboard with 40 KPIs Measures Everything and Manages Nothing
Every quarter adds a metric and none is removed, until management reviews forty numbers a month and acts on none of them. This piece sets out what a KPI system that actually changes decisions looks like.
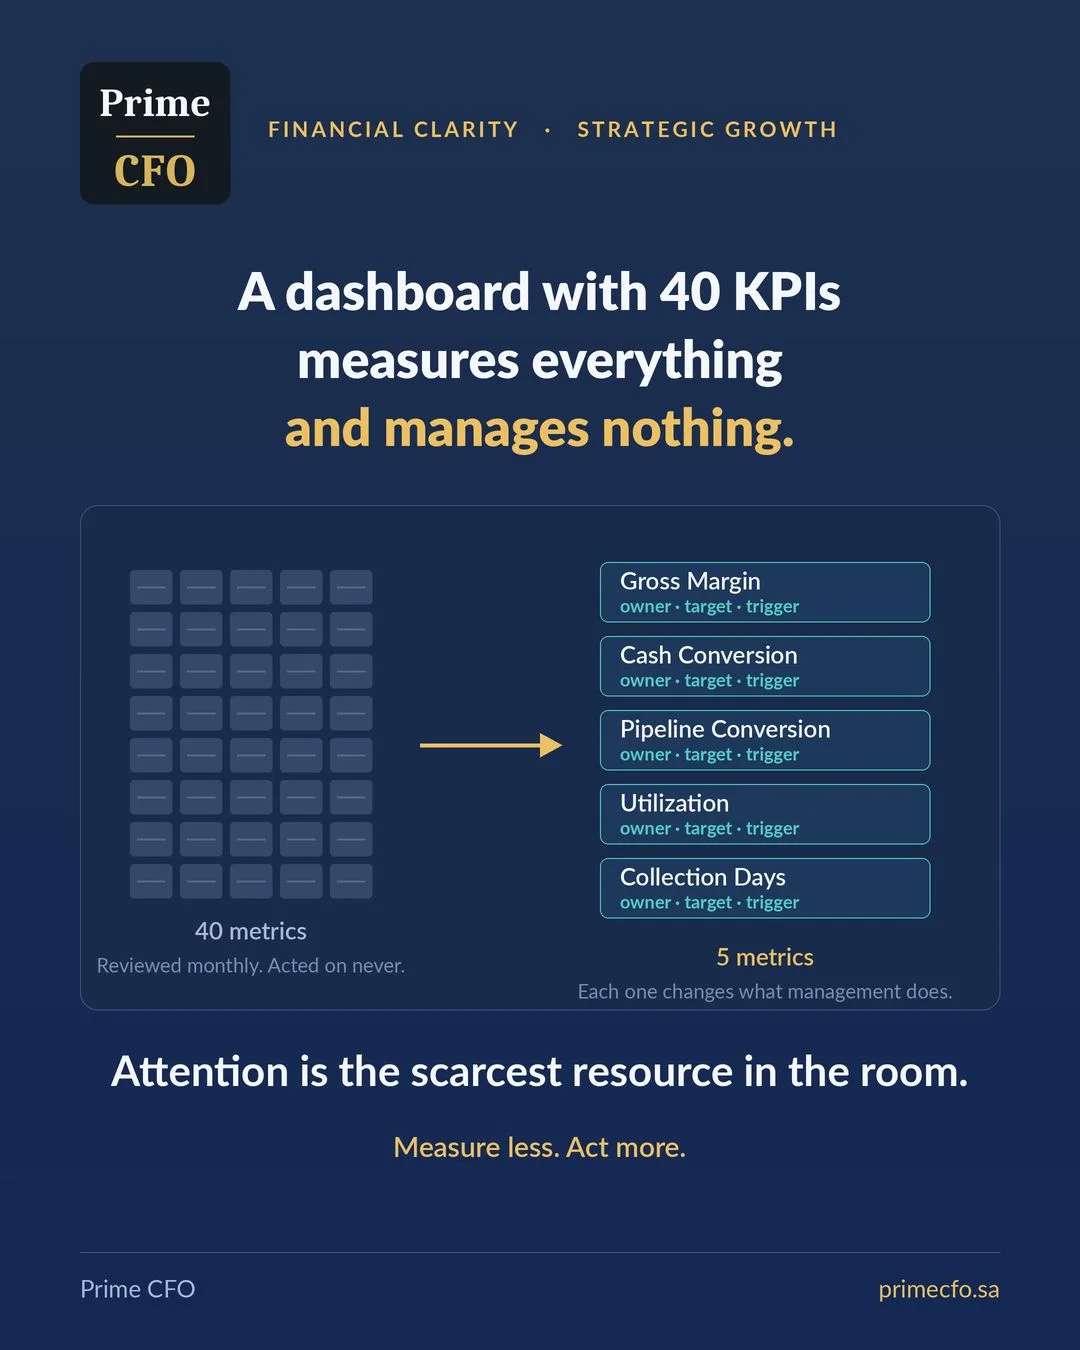
The reporting pack in growing companies only ever expands. Each quarter someone requests a new metric and it is added; nobody dares remove an old one for fear it matters to someone. Three years later management faces forty numbers in its monthly meeting, reviews all of them, and acts on none.
The paradox is that this expansion looks like discipline. A crowded dashboard suggests the company measures everything and controls everything. The reality is the opposite: more metrics do not create control, they dilute attention. And attention, not data, is the scarcest resource in the management room.
First: few enough to argue about
Five to eight metrics at executive management level. The test is practical and simple: if the monthly meeting cannot discuss every number on the dashboard, the dashboard is too large.
This does not mean discarding the rest of the data. Detailed metrics remain at the operating-department level where they are managed daily, and rise to the executive table only when they cross an agreed threshold. This hierarchy is not organizational luxury; it is what protects decision time.
Second: tied to a decision
Every metric must answer one question before it is adopted: if this number moves the wrong way, what specifically will we do? If there is no clear answer, it is information, not a KPI.
This single question is enough to clean up any dashboard. Try it on your current metrics and you will find many exist because they were available or because someone once asked for them, not because they drive a decision.
Third: an owner with a target
A number nobody owns is a number nobody moves. Each metric needs one name beside it, a defined target, and a threshold that, once crossed, triggers action rather than a remark.
The distinction between a target and a threshold matters: the target is what we aim for; the threshold is the point where discussion stops and execution begins. A dashboard without clear thresholds produces meetings that observe rather than decide.
Fourth: leading, not just lagging
Revenue and margin tell you what already happened, and by the time a problem shows in them it has occurred. Pipeline conversion, utilization, and collection days tell you what happens next while you can still influence it.
Collection days rising from sixty to seventy-five is a leading indicator of liquidity pressure two months out. A falling pipeline conversion rate is a leading indicator of a revenue gap a quarter out. A good dashboard looks forward more than back, and the practical rule is that at least half your metrics should be leading.
Fifth: stable definitions
If gross margin is calculated three ways in three reports, every meeting begins with an argument about the number instead of a decision about the business. This is among the most time-wasting problems in growing companies, and among the easiest to fix.
The fix is a written, approved metric dictionary: for each metric, one definition, one data source, one calculation method, and one frequency. A single page ends an argument that recurs every month.
How to clean up your dashboard in practice
- List every current metric and ask it the decision question: if it moves the wrong way, what do we do? Remove every one without an answer.
- Keep five to eight at management level and push the rest down to their operating level.
- For each remaining metric write down: the owner, the target, the threshold that triggers action, and the action itself.
- Check that at least half are leading; if all are lagging, you are managing through the rear-view mirror.
- Document the definitions in an approved dictionary, and review the whole dashboard once a year rather than every quarter.
The real test is not how many metrics your dashboard shows, but how often those metrics changed what management actually does. Measure less, act more.
Designing the KPI system and tying it to executive decisions is an integral part of what a Fractional CFO does. Of the leading indicators mentioned, collection days and their impact are covered in the 13-week cash flow forecast, and the effect of reading a metric early appears in decision speed and capital allocation.
How many metrics on your dashboard actually change a decision?
The financial diagnostic reviews the quality of your management reporting and metrics, identifying what deserves to stay and what should go.
Request a Financial Diagnostic